NWB Workshops and Hackathons
Visualization of hierarchical icephys experiments
Key Investigators
- Ben Dichter (Ben Dichter Consulting LLC)
- Liviu S. (Laboratory of Neural Microcircuitry & Blue Brain Project, EPFL)
Project Description
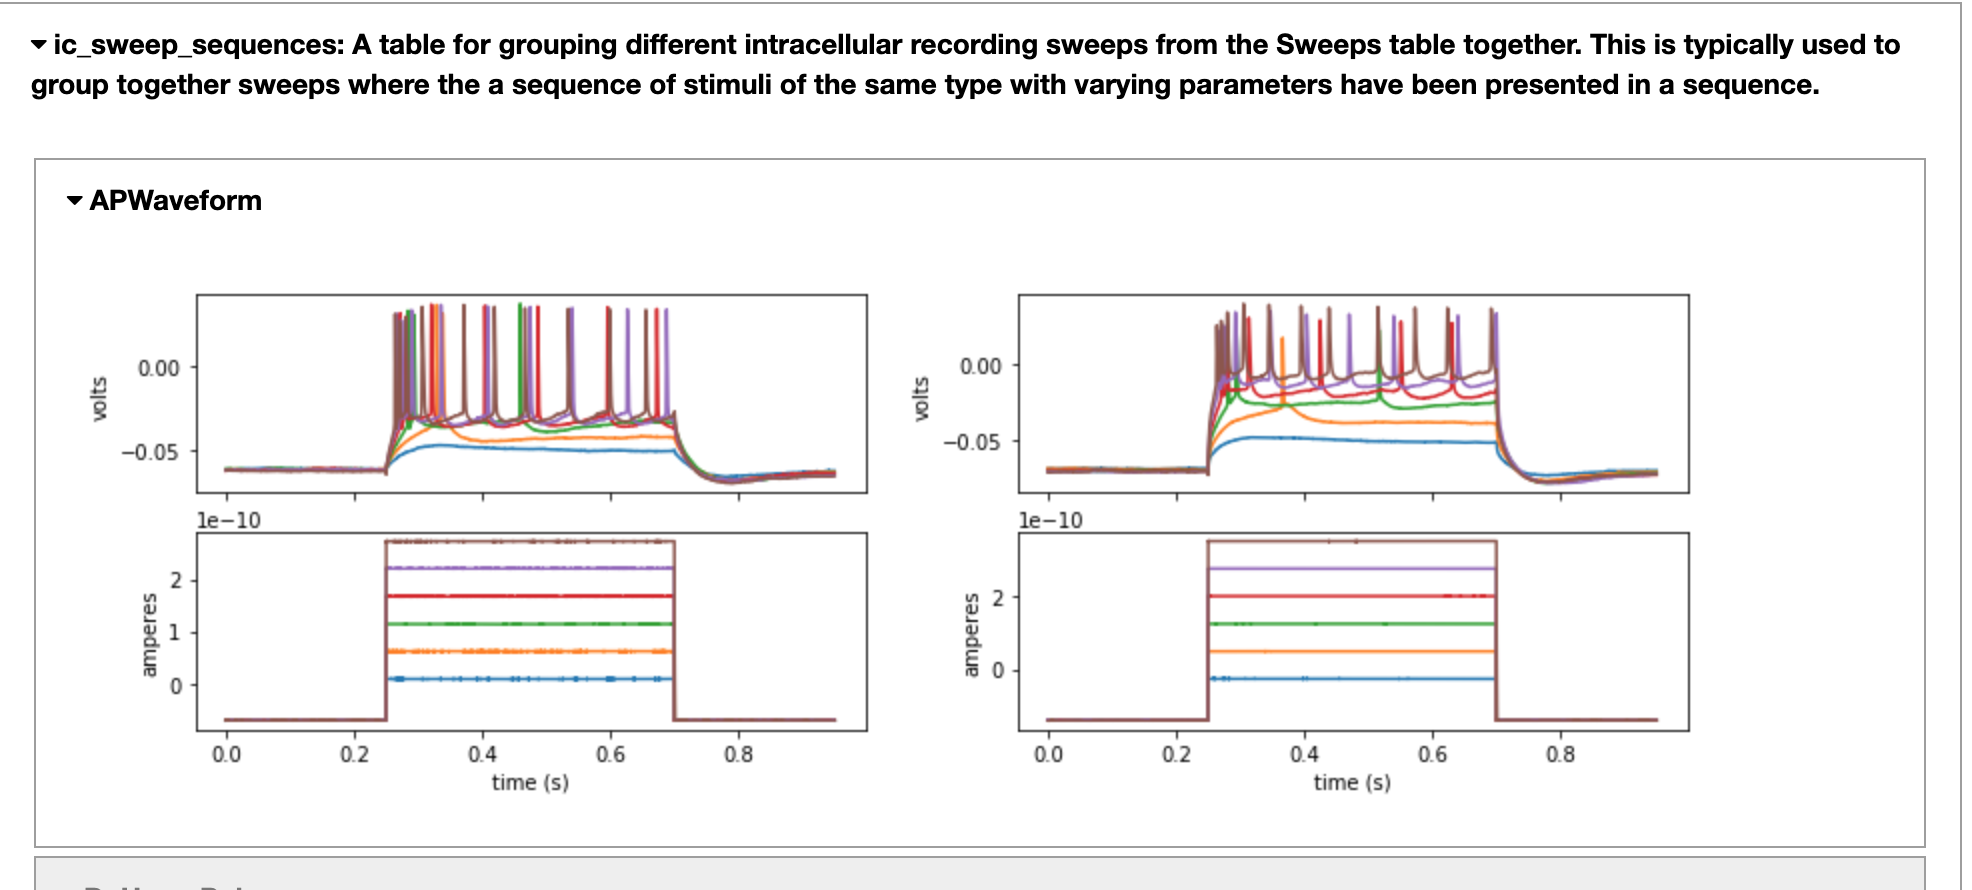
The jupyter widget will combine and plot traces at the same level of the hierarchy.
For example, for a given Stimulus Type and Electrode, under the ic_sweep_sequences
table, plot all stimulation and response traces, as in the picture below:
Objectives
Approach and Plan
Progress and Next Steps